Using NodeRED
Connecting to the dashboard
- Enter IP obtained from the previous step into a web browser (Google Chrome preffered) in the following format:
YOURIP:1880
Example:192.168.2.61:1880
- The NodeRED dashboard should appear, with the
Culnet OStab and nodes on the nodes list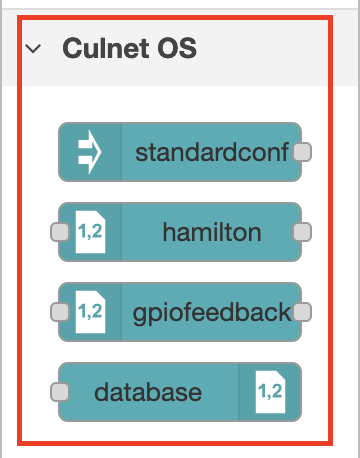
Loading the template nodes
- Locate the menu icon on the top right corner of the dashboard
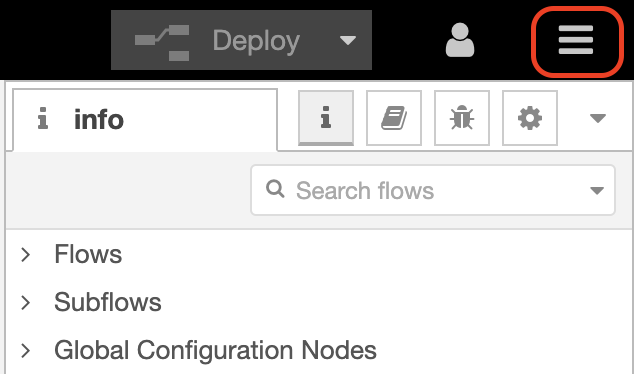
- Click on
Import, thenExamples - Locate the
node-red-culnetv2dropdown in the Examples tab - Select
readdoand clickImport - Click and place nodes on the flow
- Your flow should look something like this
Configuring the nodes
The first node: standardconf
This node will be the trigger node, starting the flow. Contents of this node are not used as of this moment.
The second node: modbus
This node will talk to the DO sensor via a serial port. Once it's done reading, the data is sent on msg.payload to the next node.
- Click on the Modbus node to reveal the configuration panel
- Enter fields as shown below and click
Done
| Name | Value |
|---|---|
| Port | /dev/ttyUSB0 |
| Device ID | 1 |
| Baud Rate | 19200 |
| Register | 2089 |
| Read Length | 10 |
| Stop Bits | 2 |
| Parity | none |
Note the reading register is set to 2089; to read from 2090
More information on the Modbus protocol for Hamilton DO Arc sensors are available here.
The third node: hamilton
This node will decode data given from the modbus node and return a float value stored in a object in msg.sensors
- Click on the Hamilton node to reveal the configuration panel
- Enter a sensor name, select
DOfor sensor input type, and click onDone
The fourth node: debug
This node is part of NodeRED, for displaying msg from upstream nodes.
- Click on the debug node to reveal the configuration panel
- Make sure
Outputis set tocomplete msg objectand inTo,Debug Windowis checked. Click onDone
Save the flow
Once you configure all nodes, it's time to save the flow. Click on Deploy located on the top right corner.
Running the flow
Once you've done configuring the flow it's time to run it.
Opening the Debug panel
Before running you will need to open the Debug panel to see the outputs.
Locate the bug icon on the menu on the top right corner
Starting the flow
Click on the button on the standardconf node
Checking the results
On the debug panel, a new message should appear. Expand the sensors and sensor name object to reveal the results.
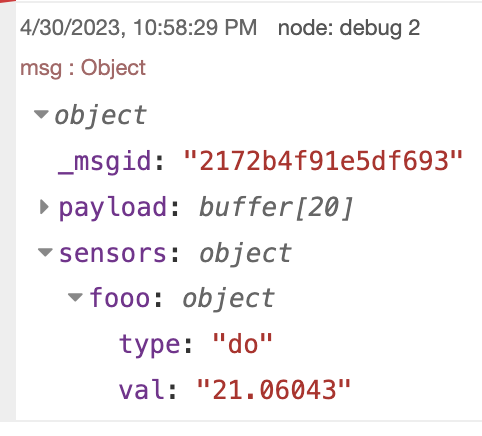
If it looks something like this, congratulations! You successfully ran your first flow 🎉